• Log In
  • Skip to primary navigation
  • Skip to content
  • Skip to primary sidebar
  • Skip to footer

Information Technology News Archive

1996 - 2017

  • Home
  • About OIT
You are here: Home / Archives for Tony Soeller

Tony Soeller

GIS Geodatabase Covers UCI Campus

May 16, 2013 by Tony Soeller

For several years OIT staff have been collaborating with staff in Environmental Planning and Sustainability, Space Management, Facilities Management, Environmental Health & Safety, and the UCI Police Department to develop detailed Geographic Information System (GIS) data that represent the campus in its entirety.  The data can be used to develop custom GIS maps of the campus as a whole or for specific areas, to identify campus features (meaning things on the ground) and their associated attributes, and to extract information associated with individual features or groups of features.  Collectively these data products constitute a digital map base, specifically a geodatabase, for the campus.  OIT and other campus departments have been using the geodatabase for mapping purposes and for analyzing details of features.

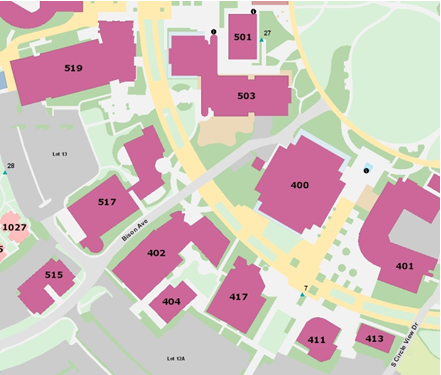
Initial efforts focused on developing data for the greater campus infrastructure including campus buildings, streets, parking, fire lanes and walkways.  Subsequently, GIS data representing nearly every square foot of the entire campus have been acquired and added to the campus GIS.  Many new data themes now exist such as lawn, shrubbery, mixed landscape, open areas (native plants, water and exposed ground), athletic areas, points of interest, etc.  Within each data theme individual features are distinguished by their type and that information is stored in the geodatabase.  For example, for the buildings theme there are seven unique types and each type is identifiable on the map by its type color.  The detailed map below, covering a portion of Physical Sciences and Biological Sciences Quads, shows several of these data themes that are contained in the campus geodatabase.

Campus GIS

Several projects are currently employing the campus geodatabase.  In one project, 71 detailed maps covering the campus as a map grid have been made.  These maps were developed in conjunction with auxiliary emergency-related data, to support the UCI Police Department and Orange County Fire Authority for emergency response.

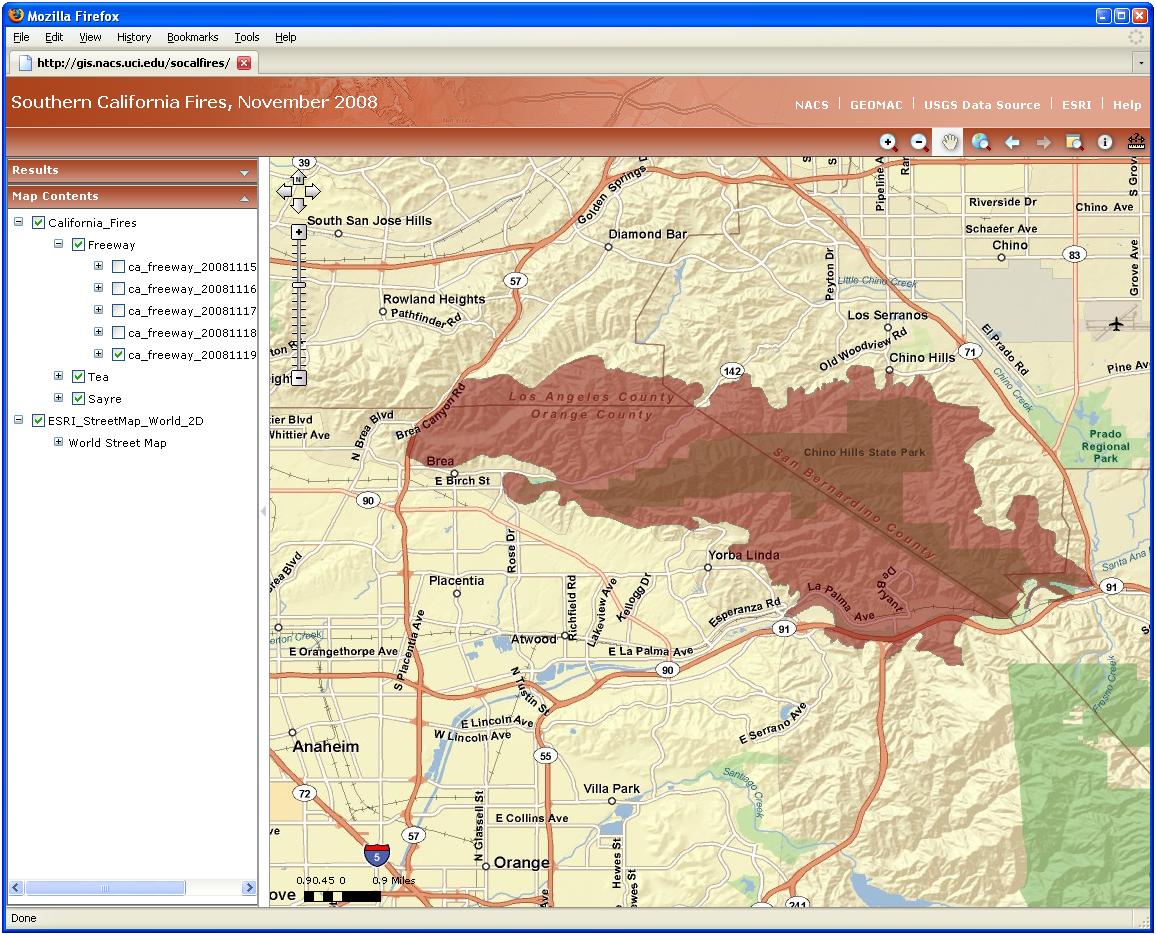
You can view the campus GIS map online using the following link:

http://gis.oit.uci.edu/uci/campus/

Campus employees who are interest in using the UCI geodatabase or who are interested in developing their own geodatabase for their research should contact Tony Soeller (tsoeller@uci.edu).

Filed Under: About OIT, Research Support Tagged With: databases, GIS, maps

Online Geographic Information System Services

December 10, 2008 by Tony Soeller

Geographic Information System (GIS) software has traditionally been used on desktop computers to develop, display, and analyze spatial data.  Recent advances in web-based GIS software now allow researchers and instructors to upload their spatial data to online GIS services.  Colleagues and students can then view and query — and even edit — GIS data online via a web browser and without having GIS software installed on their desktop computers.

NACS uses ESRI’s ArcGIS Server to provide online GIS services.  Development of a new online GIS service is straightforward.  Once an ArcGIS Desktop document is developed, the document and associated GIS data files are uploaded to an ArcGIS Server. A GIS service is generated and custom data queries are assigned. The URL for this new GIS service can then be distributed for users to visit the new site.

NACS has been developing GIS services using ArcGIS Server for two years.  If you are interested in making your GIS data available online, we can develop a GIS service on our server using your data, or we can help you set up ArcGIS Server on your own or a departmental system.

Here are a few ArcGIS Server applications running on the NACS GIS server.  When viewing these GIS services, consider how your own spatial data might be displayed and explored using ArcGIS Server.

Recent Southern California fires (Freeway, Tea, and Sayre) using ESRI basemap data and fire perimeters collected by the Geospatial Multi-Agency Coordination.

California No Child Left Behind, within the UCI Department of Education.

History of North American Indians used for instruction within the UCI Department of History.

Filed Under: Instructional Support, Research Computing, Research Support Tagged With: GIS, Research Computing

GIS Technology in UCI Research

June 22, 2007 by Tony Soeller

Geographical Information Systems (GIS) is a technology which is finding ever broader use in the UCI research community. NACS Research Computing Specialist Tony Soeller has been supporting GIS software, teaching workshops, and working directly with faculty and graduate students on research projects to exploit GIS tools. Here are some recent examples.

Professor Bradford Hawkins in Ecology and Evolutionary Biology is tracking global species diversity in birds. GIS was used on a massive spatial data synthesis project on global bird ranges to georegister, digitize and rasterize bird range maps, then to summarize the number of bird species within discrete cells 27.5 to 220 km on a side. Numerous ArcGIS programs (ArcObjects and VBA) were written to help in the processing of the data.

Cristiane Surbeck completed her Ph.D. studies in Professor Stan Grant’s lab in Chemical Engineering and Materials Sciences and is now an Assistant Professor at University of Mississippi. Cris has been analyzing the Santa Ana River Watershed. Her research looked at the biological and sediment constituents of runoff into the Santa Ana River from three storm events within the watershed, and compared these data to rainfall volume and land use types which contributed to the runoff. GIS was used to synthesize land use data with rainfall data from the storm events, to delineate individual storm watersheds, and to determine the area of land within each land use type and the amount of precipitation within each of those land use types.

Satish Vutuku, a student in Professor Donald Dabdub’s lab in Mechanical and Aerospace Engineering is examining the impact on air quality of distributed power generation.

In one project, Satish assessed atmospheric impact of emissions from distributed power generation (DG) sources. DG refers to “on-site” generation of power using technologies such as fuel cells and micro turbines. Such DG installations emit pollutants in an urban area in a highly dispersed manner, in contrast to conventional huge power plants that emit pollutants as a concentrated plume far away from urban areas. In order to analyze effects of such DG emissions, Satish created a set of “DG scenarios” that would predict the adoption of DG technologies and corresponding emissions. The development of DG scenarios was based upon highly-detailed land-use data and population data. The land-use data were obtained as GIS files and were formatted to fit the model grid and resolution with help from Tony Soeller.
This is just a sampling of the many projects at UCI which are making use of GIS software and Tony’s expertise. Please contact NACS if you would be interested in exploring the relevance of GIS to your research project.

Filed Under: Research Computing, Staff Tagged With: GIS, Research Comuputing

Primary Sidebar

Links

  • Office of Information Technology
  • UC Irvine

Recent Posts

  • In Brief April 2017
  • Eduroam… WOW!
  • Tips and Tricks: Webfiles
  • Campus Radio System Upgrade
  • OIT Does That? Classrooms and Labs

IT News Archives

Need Help?

  • Call Us - (949) 824-2222
  • Email Us - oit@uci.edu
  • Help Desk
  • Knowledgebase

About OIT

  • OIT Employment Opportunities
  • Org Chart (PDF)
  • Policies

Contact Us

Office of Information Technology
University of California, Irvine
Irvine, CA 92697

949-824-2222

© 2025 UC Regents